
Understanding the Analytics Overview
Who can do this: Admins, and staff with the View Analytics permission
The Overview gives you a snapshot of the whole platform on one page.
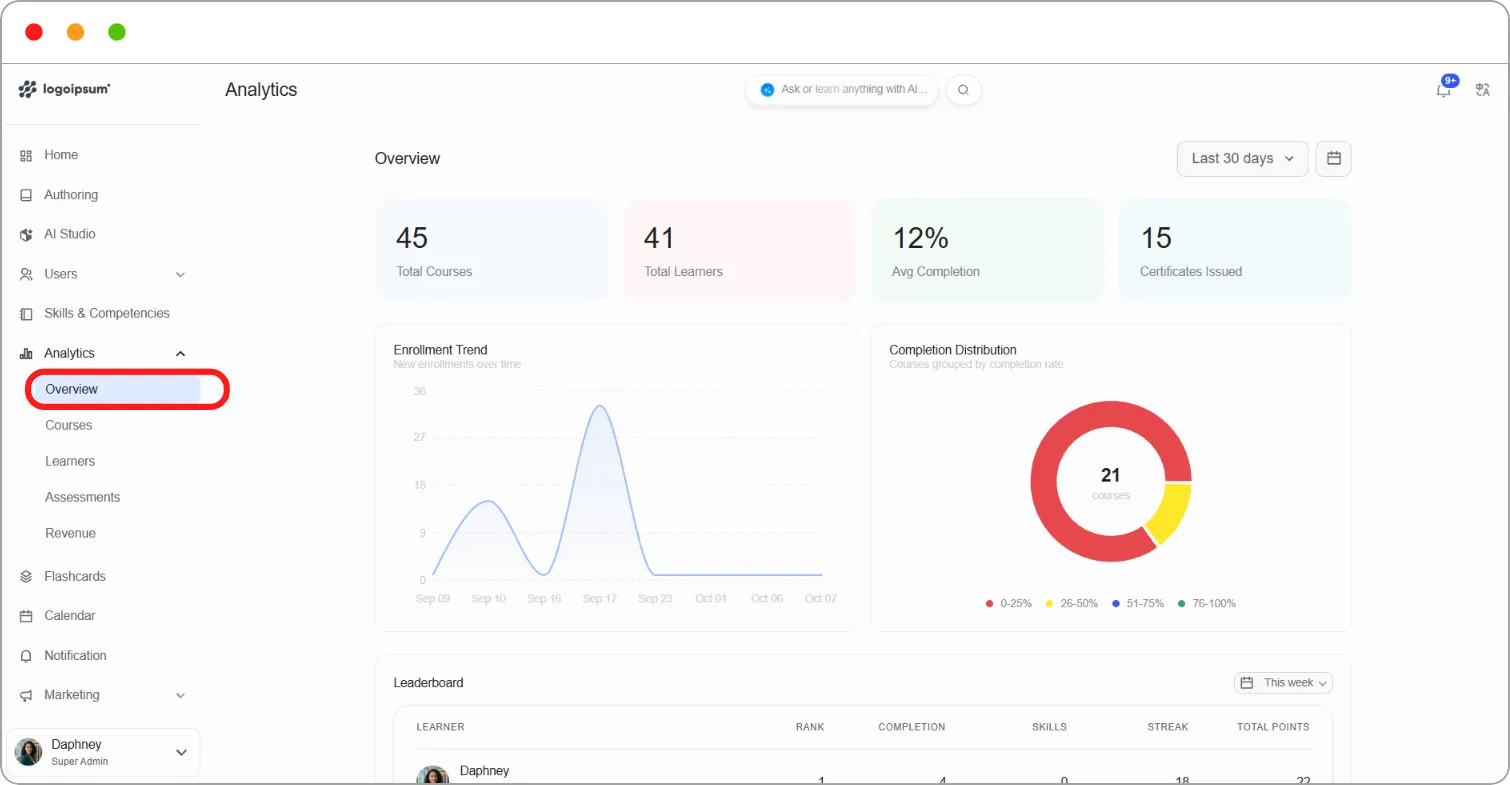
Step 1: Go to Analytics > Overview.
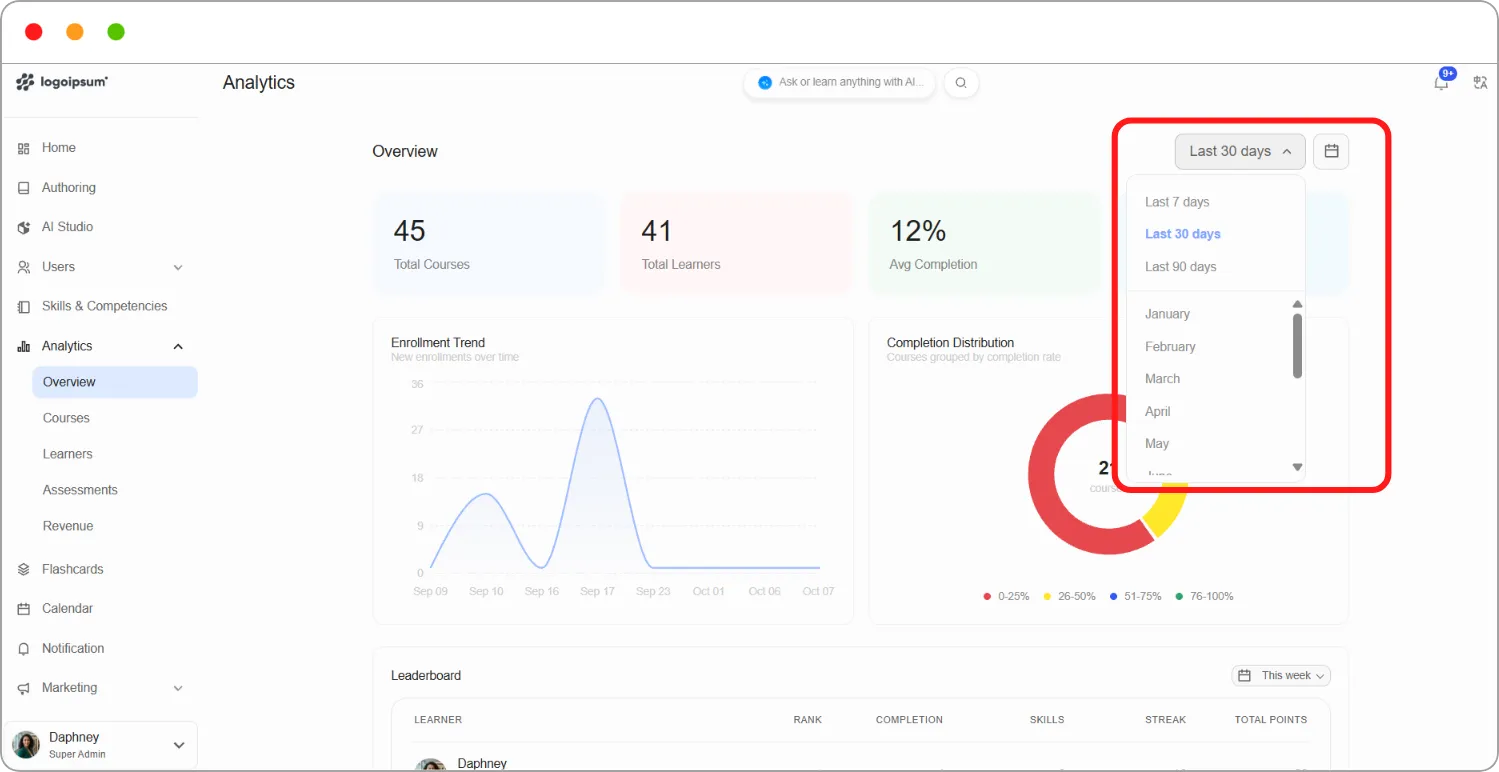
Step 2: To change the period the page covers, click the date menu at the top right and choose:
| Option | What it covers |
|---|---|
| Last 7 days / Last 30 days / Last 90 days | The most recent 7, 30 or 90 days |
| A month, for example January | That whole month |
To choose your own dates, click the calendar icon and select a start and end date. The date menu then shows your range, for example Oct 1 – Oct 4.
Note: The date range changes the Enrollment Trend chart. The leaderboard has its own period menu.
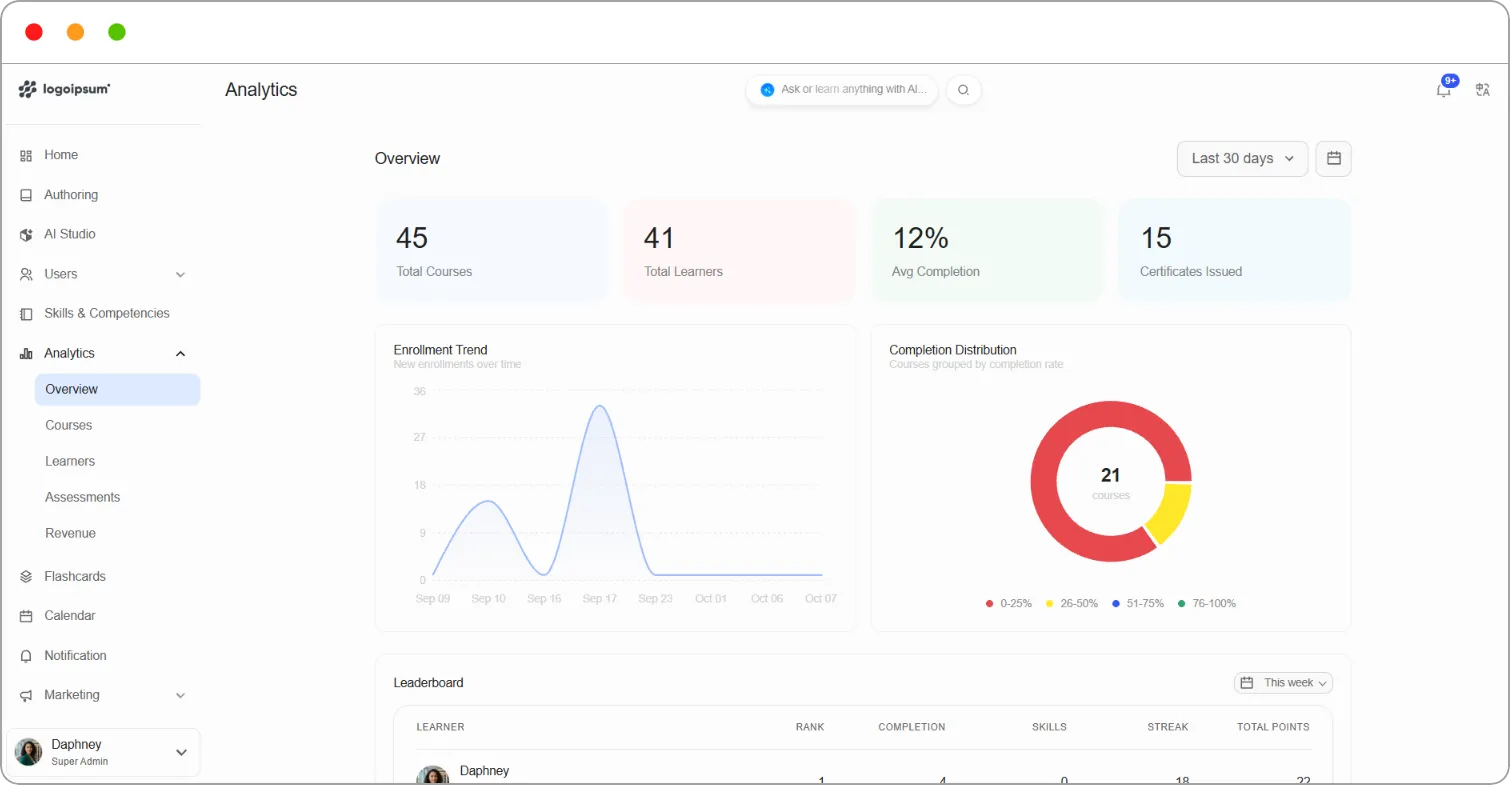
Summary cards
Section titled “Summary cards”| Card | What it shows |
|---|---|
| Total Courses | The number of courses on your platform |
| Total Learners | The number of learners on your platform |
| Avg Completion | The average completion rate across all courses |
| Certificates Issued | The number of certificates learners have earned |
Charts
Section titled “Charts”| Chart | What it shows |
|---|---|
| Enrollment Trend | New enrolments over time. Hover over the line to see the number for a specific day |
| Completion Distribution | Courses grouped by completion rate: 0–25%, 26–50%, 51–75% and 76–100%. The number in the centre is the total number of courses |
Tip: If most of the Completion Distribution ring is in the 0–25% band, learners are starting courses but not finishing them. Look at the Courses report to find out which courses are holding them back.
Leaderboard
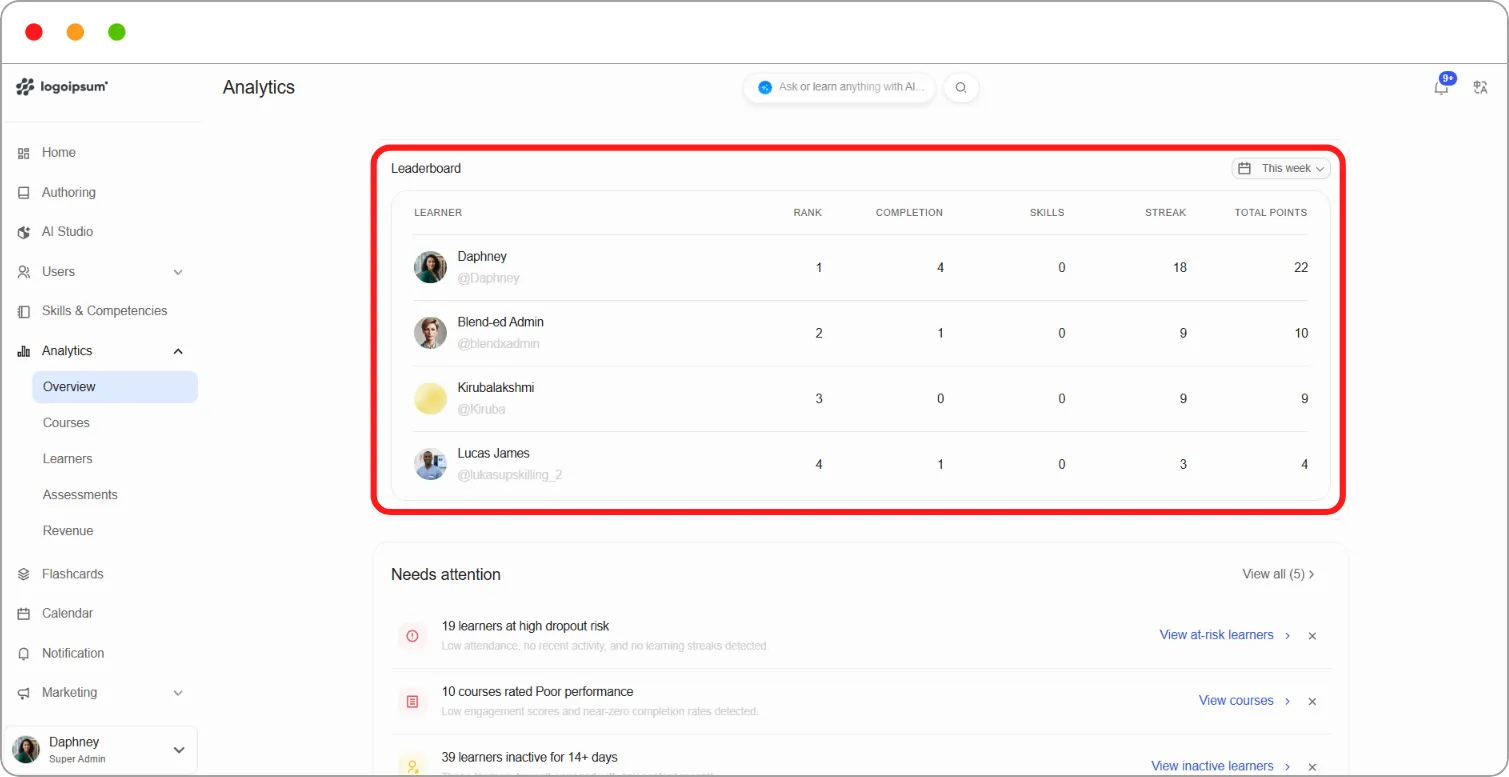
Section titled “Leaderboard”The Leaderboard ranks learners by points. For each learner it shows:
| Column | What it shows |
|---|---|
| Rank | Their position on the leaderboard |
| Completion | The number of lessons they’ve completed |
| Skills | The number of skills verified |
| Streak | Points from their learning streak |
| Total Points | Their total points |
Use the period menu, for example This week, to change the period the leaderboard covers.
Needs attention
Section titled “Needs attention”The bottom of the Overview shows the Needs attention panel. See General overview: Reporting & Analytics.